Dienstag, 5. April 2016

Learning Lucene

I am currently working with a team starting a new project based on Lucene. While most of the time I would argue on using either Solr or Elasticsearch instead of plain Lucene it was a conscious decision. In this post I am compiling some sources for learning Lucene – I hope you will find them helpful or you can hint what sources I missed.

Project documentation

The first choice of course is the excellent project documentation. It contains the Javadoc for all the modules (core, analyzers-common and queryparser being the most important ones) that also contains further documentation, for example an explanation of a simple demo app and helpful introductions to analysis and querying and scoring. You might also be interested in the standard index file formats.

Besides the documentation that comes with the releases there is also lots of information in the project wiki but you need to know what you are looking for. You can also join the mailing lists to learn about what other users are doing.

When looking at analyzer components the Solr Start website can be useful. Though dedicated to Solr the list of analyzer components can be useful to determine analyzers for Lucene as well. It also contains a searchable version of the Javadocs.

Books

The classic book about the topic is Lucene in Action. On over 500 pages it explains all the underlying concepts in detail. Unfortunately some of the information is outdated and lots of the code examples won't work anymore. Also the newer concepts are not included. Still it's the recommended piece on learning Lucene.

Anonther book I've read is Lucene 4 Cookbook published at Packt. It contains more current examples but is not suited well for learning the basics. Additionally it felt to me as if no editor worked on this book, there are lots of repetitions, typos and broken sentences. (I am making lots of grammar mistakes myself when blogging - but I am expecting more from a published book.)

You can also learn a lot about different aspects of Lucene by reading a book on one of the search servers based on it. I can recommend Elasticsearch in Action, Solr in Action and Elasticsearch – The definitive Guide. (If you can read German I am of course inviting you to read my book on Elasticsearch.)

Blogs, Conferences and Videos

There are countless blog posts on Lucene, a very good introduction is Lucene: The Good Parts by Andrew Montalenti. Some blogs publish regular pieces on Lucene, recommended ones are by Mike McCandless (who now mostly blogs on the elastic Blog), OpenSource Connections, Flax and Uwe Schindler. There is a lot of content about Lucene on the elastic Blog, if you want to hear about current development I can recommend the "This week in Elasticsearch and Apache Lucene" series. There are also some interesting posts on the Lucidworks Blog and I am sure there are lots of other blogs I forgot to mention here.

Lucene is a regular topic on two larger conferences: Lucene/Solr Revolution and Berlin Buzzwords. You can find lots of video recordings of the past events on their website.

Sources

Finally, the project is open source so you can learn a lot about it by reading the source code of either the library or the tests.

Another option is to look at applications using it, either Solr and Elasticsearch. Of course you need to find your way around the sources of the project but sometimes this isn't too hard. One example for Elasticsearch: If you would like to learn about how the common multi_match-Query is implemented in Lucene you will easily find the class MultiMatchQuery that creates the Lucene queries.

What did I miss?

I hope there is something useful for you in this post. I am sure I missed lots of great resources for learning Lucene. If you would like to add one let me know in the comments or on Twitter.

Mittwoch, 23. März 2016

Logging Requests to Elasticsearch

This is something I wanted to write down for years but never got down to completing the post. It can help you a lot with certain Elasticsearch setups by answering two questions using the slow log.

  • Is my application talking to Elasticsearch?
  • What kind of queries are being built by my application?

A while ago I helped a colleague on one of my current projects to debug some problems with Elasticsearch integrated into proprietary software. He was not sure if there are any requests arriving at Elasticsearch and what those look like. We activated the slow log for Elasticsearch, which not only can be used to log the slow queries but also to enable debugging for any queries that reach Elasticsearch.

The slow log, as the name suggests, is there to log slow requests. As slow is a subjective term you can define thresholds that need to be passed. For example you can define that any queries slower than 50ms are logged in the debug level but any queries that take longer than 500ms in the warn level.

Slow queries can be configured for both phases of the query execution: query and fetch. In the query phase only the ids of the documents are retrieved in the form of a search result list. The fetch phase is where the result documents are retrieved.

Besides the slow query log there is also the slow index log which can be used in the same way but measures the time for indexing.

Both of these settings are index settings. That means they are configured for each index and can therefore be different across indices.

Instance Settings

There are multiple places where you can configure index settings. The first is config/elasticsearch.yml that contains the configuration of the instance. For older versions of Elasticsearch it already contains the lines that are commented out, in newer versions you need to include them yourself. If you want to log all requests at debug level you can just add the following lines and set a threshold of 0s.

index.search.slowlog.threshold.query.debug: 0s
index.search.slowlog.threshold.fetch.debug: 0s
index.indexing.slowlog.threshold.index.debug: 0s

You need to reboot the instance so that the settings are activated. Any indexing and search requests will now be logged to separate log file in the log folder. With the default configuration the logs will be at logs/elasticsearch_index_indexing_slowlog.log and logs/elasticsearch_index_search_slowlog.log. The query log will now contain entries like this:

[2016-03-23 06:43:47,231][DEBUG][index.search.slowlog.fetch] took[5.8ms], took_millis[5], types[talk], stats[], search_type[QUERY_THEN_FETCH], total_shards[5], source[{"query":{"match":{"tags":"Java"}}}], extra_source[]

If you are testing this with multiple shards on one instance you might get more log lines than expected: There will be one line for every shard in the query phase and one line for the fetch phase.

Runtime Settings

Besides the setting in elasticsearch.yml the slow request logs can also be activated using the HTTP API which doesn't require a reboot of the instance and is therefore really well suited for debugging production issues. The following request changes the setting for the query log for an index conference.

curl -XPUT "http://localhost:9200/conference/_settings" -d'
{
    "index.search.slowlog.threshold.query.debug": "0s"
}'

When you are done debugging your issue you can just set a higher threshold again.

Donnerstag, 23. Juli 2015

ActiveMQ as a Message Broker for Logstash

When scaling Logstash it is common to add a message broker that is used to temporarily buffer incoming messages before they are being processed by one or more Logstash nodes. Data is pushed to the brokers either through a shipper like Beaver that reads logfiles and sends each event to the broker. Alternatively the application can send the log events directly using something like a Log4j appender.

A common option is to use Redis as a broker that stores the data in memory but using other options like Apache Kafka is also possible. Sometimes organizations are not that keen to introduce lots of new technology and want to reuse existing stores. ActiveMQ is a widely used messaging and integration platform that supports different protocols and looks just perfect for the use as a message broker. Let's see the options to integrate it.

Setting up ActiveMQ

ActiveMQ can easily be set up using the scripts that ship with it. On Linux it's just a matter of executing ./activemq console. Using the admin console at http://127.0.0.1:8161/admin/ you can create new queues and even enqueue messages for testing.

Consuming messages with AMQP

An obvious way to try to connect ActiveMQ to Logstash is using AMQP, the Advanced Message Queuing Protocol. It's a standard protocol that is supported by different messaging platforms.

There used to be a Logstash input for AMQP but unfortunately it has been renamed to rabbitmq-input because RabbitMQ is the main system that is supported.

Let's see what happens if we try to use the input with ActiveMQ.

input {
    rabbitmq {
        host => "localhost"
        queue => "TestQueue"
        port => 5672
    }
}

output {
    stdout {
        codec => "rubydebug"
    }
}

We tell Logstash to listen on localhost on the standard port on a queue named TestQueue. The result should just be dumped to the standard output. Unfortunately Logstash only issues errors because it can't connect.

Logstash startup completed
RabbitMQ connection error: . Will reconnect in 10 seconds... {:level=>:error}

In the ActiveMQ logs we can see that our parameters are correct but unfortunately both systems seem to speak different dialects of AMQP.

 WARN | Connection attempt from non AMQP v1.0 client. AMQP,0,0,9,1
org.apache.activemq.transport.amqp.AmqpProtocolException: Connection from client using unsupported AMQP attempted
...

So bad luck with this option.

Consuming messages with STOMP

The aptly named Simple Text Oriented Messaging Protocol is another option that is supported by ActiveMQ. Fortunately there is a dedicated input for it. It is not included in Logstash by default but can be installed easily.

bin/plugin install logstash-input-stomp

Afterwards we can just use it in our Logstash config.

input {
    stomp {
        host => "localhost"
        destination => "TestQueue"
    }
}

output {
    stdout {
        codec => "rubydebug"
    }
}

This time we are better off: Logstash really can connect and dumps our message to the standard output.

bin/logstash --config stomp.conf 
Logstash startup completed
{
       "message" => "Can I kick it...",
      "@version" => "1",
    "@timestamp" => "2015-07-22T05:42:35.016Z"
}

Consuming messages with JMS

Though the stomp-input works there is even another option that is not released yet but can already be tested: jms-input supports the Java Messaging System, the standard way of doing messaging on the JVM.

Currently you need to build the plugin yourself (which didn't work on my machine but should be caused by my outdated local jruby installation).

Getting data in ActiveMQ

Now that we know of ways to consume data from ActiveMQ it is time to think about how to get data in. When using Java you can use something like a Log4j- or Logback-Appender that push the log events directly to the queue using JMS.

When it comes to shipping data unfortunately none of the more popular solutions seems to be able to push data to ActiveMQ. If you know of any solution that can be used it would be great if you could leave a comment.

All in all I think it can be possible to use ActiveMQ as a broker for Logstash but it might require some more work when it comes to shipping data.

Freitag, 6. Februar 2015

Fixing Elasticsearch Allocation Issues

Last week I was working with some Logstash data on my laptop. There are around 350 indices that contain the logstash data and an index that holds the metadata for Kibana 4. When trying to start the single node cluster I have to wait a while, until all indices are available. Some APIs can be used to see the progress of the startup process.

The cluster health API gives general information about the state of the cluster and indicates if the cluster health is green, yellow or red. After a while the number of unassigned shards didn't change anymore but the cluster still stayed in a red state.

curl -XGET 'http://localhost:9200/_cluster/health?pretty=true'
{
  "cluster_name" : "elasticsearch",
  "status" : "red",
  "timed_out" : false,
  "number_of_nodes" : 1,
  "number_of_data_nodes" : 1,
  "active_primary_shards" : 1850,
  "active_shards" : 1850,
  "relocating_shards" : 0,
  "initializing_shards" : 0,
  "unassigned_shards" : 1852
}

One shard couldn't be recovered: 1850 were ok but it should have been 1851. To see the problem we can use the cat indices command that will show us all indices and their health.

curl http://localhost:9200/_cat/indices
[...]
yellow open logstash-2014.02.16 5 1 1184 0   1.5mb   1.5mb 
red    open .kibana             1 1                        
yellow open logstash-2014.06.03 5 1 1857 0     2mb     2mb 
[...]

The .kibana index didn't turn yellow. It only consists of one primary shard that couldn't be allocated.

Restarting the node and closing and opening the index didn't help. Looking at elasticsearch-kopf I could see that primary and replica shards both were unassingned (You need to tick the checkbox that says hide special to see the index).

Fortunately there is a way to bring the cluster in a yellow state again. We can manually allocate the primary shard on our node.

Elasticsearch provides the Cluster Reroute API that can be used to allocate a shard on a node. When trying to allocate the shard of the index .kibana I first got an exception.

curl -XPOST "http://localhost:9200/_cluster/reroute" -d'
{
    "commands" : [ {
          "allocate" : {
              "index" : ".kibana", "shard" : 0, "node" : "Jebediah Guthrie"
          }
        }
    ]
}'

[2015-01-30 13:35:47,848][DEBUG][action.admin.cluster.reroute] [Jebediah Guthrie] failed to perform [cluster_reroute (api)]
org.elasticsearch.ElasticsearchIllegalArgumentException: [allocate] trying to allocate a primary shard [.kibana][0], which is disabled
Fortunately the message already tells us the problem: By default you are not allowed to allocate primary shards due to the danger of losing data. If you'd like to allocate a primary shard you need to tell it Elasticsearch explicitly by setting the property allow_primary.
curl -XPOST "http://localhost:9200/_cluster/reroute" -d'
{
    "commands" : [ {
          "allocate" : {
              "index" : ".kibana", "shard" : 0, "node" : "Jebediah Guthrie", "allow_primary": "true"
          }
        }
    ]
}'

For me this helped and my shard got reallocated and the cluster health turned yellow.

I am not sure what caused the problems but it is very likely related to the way I am working locally. I am regularly sending my laptop to sleep which is something you never do on a server. Nevertheless I have seen this problem a few times locally which justifies writing down the necessary steps to fix it.

Freitag, 23. Januar 2015

Logging to Redis using Spring Boot and Logback

When doing centralized logging, e.g. using Elasticsearch, Logstash and Kibana or Graylog2 you have several options available for your Java application. You can either write your standard application logs and parse those using Logstash, either consumed directly or shipped to another machine using something like logstash-forwarder. Alternatively you can write in a more appropriate format like JSON directly so the processing step doesn't need that much work for parsing your messages. As a third option is to write to a different data store directly which acts as a buffer for your log messages. In this post we are looking at how we can configure Logback in a Spring Boot application to write the log messages to Redis directly.

Redis

We are using Redis as a log buffer for our messages. Not everyone is happy with Redis but it is a common choice. Redis stores its content in memory which makes it well suited for fast access but can also sync it to disc when necessary. A special feature of Redis is that the values can be different data types like strings, lists or sets. Our application uses a single key and value pair where the key is the name of the application and the value is a list that contains all our log messages. This way we can handle several logging applications in one Redis instance.

When testing your setup you might also want to look into the data that is stored in Redis. You can access it using the redis-cli client. I collected some useful commands for validating your log messages are actually written to Redis.

CommandDescription
KEYS *Show all keys in this Redis instance
LLEN keyShow the number of messages in the list for key
LRANGE key 0 100Show the first 100 messages in the list for key

The Logback Config

When working with Logback most of the time an XML file is used for all the configuration. Appenders are the things that send the log output somewhere. Loggers are used to set log levels and attach appenders to certain pieces of the application.

For Spring Boot Logback is available for any application that uses the spring-boot-starter-logging which is also a dependency of the common spring-boot-starter-web. The configuration can be added to a file called logback.xml that resides in src/main/resources.

Spring boot comes with a file and a console appender that are already configured correctly. We can include the base configuration in our file to keep all the predefined configurations.

For logging to Redis we need to add another appender. A good choice is the logback-redis-appender that is rather lightweight and uses the Java client Jedis. The log messages are written to Redis in JSON directly so it's a perfect match for something like logstash. We can make Spring Boot log to a local instance of Redis by using the following configuration.

<?xml version="1.0" encoding="UTF-8"?>
<configuration>
    <include resource="org/springframework/boot/logging/logback/base.xml"/>
    <appender name="LOGSTASH" class="com.cwbase.logback.RedisAppender">
        <host>localhost</host>
        <port>6379</port>
        <key>my-spring-boot-app</key>
    </appender>
    <root level="INFO">
        <appender-ref ref="LOGSTASH" />
        <appender-ref ref="CONSOLE" />
        <appender-ref ref="FILE" />
    </root>
</configuration>

We configure an appender named LOGSTASH that is an instance of RedisAppender. Host and port are set for a local Redis instance, key identifies the Redis key that is used for our logs. There are more options available like the interval to push log messages to Redis. Explore the readme of the project for more information.

Spring Boot Dependencies

To make the logging work we of course have to add a dependency to the logback-redis-appender to our pom. Depending on your Spring Boot version you might see some errors in your log file that methods are missing.

This is because Spring Boot manages the dependencies it uses internally and the versions for jedis and commons-pool2 do not match the ones that we need. If this happens we can configure the versions to use in the properties section of our pom.

<properties>
    <commons-pool2.version>2.0</commons-pool2.version>
    <jedis.version>2.5.2</jedis.version>
</properties>

Now the application will start and you can see that it sends the log messages to Redis as well.

Enhancing the Configuration

Having the host and port configured in the logback.xml is not the best thing to do. When deploying to another environment with different settings you have to change the file or deploy a custom one.

The Spring Boot integration of Logback allows to set some of the configuration options like the file to log to and the log levels using the main configuration file application.properties. Unfortunately this is a special treatment for some values and you can't add custom values as far as I could see.

But fortunately Logback supports the use of environment variables so we don't have to rely on configuration files. Having set the environment variables REDIS_HOST and REDIS_PORT you can use the following configuration for your appender.

    <appender name="LOGSTASH" class="com.cwbase.logback.RedisAppender">
        <host>${REDIS_HOST}</host>
        <port>${REDIS_PORT}</port>
        <key>my-spring-boot-app</key>
    </appender>

We can even go one step further. To only activate the appender when the property is set you can add conditional processing to your configuration.

    <if condition='isDefined("REDIS_HOST") &amp;&amp; isDefined("REDIS_PORT")'>
        <then>
            <appender name="LOGSTASH" class="com.cwbase.logback.RedisAppender">
                <host>${REDIS_HOST}</host>
                <port>${REDIS_PORT}</port>
                <key>my-spring-boot-app</key>
            </appender>
        </then>
    </if>

You can use a Java expression for deciding if the block should be evaluated. When the appender is not available Logback will just log an error and uses any other appenders that are configured. For this to work you need to add the Janino library to your pom.

Now the appender is activated based on the environment variables. If you like you can skip the setup for local development and only set the variables on production systems.

Conclusion

Getting started with Spring Boot or logging to Redis alone is very easy but some of the details are some work to get right. But it's worth the effort: Once you get used to centralized logging you don't want to have your systems running without it anymore.

Freitag, 12. Dezember 2014

Use Cases for Elasticsearch: Analytics

In the last post in this series we have seen how we can use Logstash, Elasticsearch and Kibana for doing logfile analytics. This week we will look at the general capabilities for doing analytics on any data using Elasticsearch and Kibana.

Use Case

We have already seen that Elasticsearch can be used to store large amounts of data. Instead of putting data into a data warehouse Elasticsearch can be used to do analytics and reporting. Another use case is social media data: Companies can look at what happens with their brand if they have the possibility to easily search it. Data can be ingested from multiple sources, e.g. Twitter and Facebook and combined in one system. Visualizing data in tools like Kibana can help with exploring large data sets. Finally mechanisms like Elasticsearchs Aggregations can help with finding new ways to look at the data.

Aggregations

Aggregations provide what the now deprecated facets have been providing but also a lot more. They can combine and count values from different documents and therefore show you what is contained in your data. For example if you have tweets indexed in Elasticsearch you can use the terms aggregation to find the most common hashtags. For details on indexing tweets in Elasticsearch see this post on the Twitter River and this post on the Twitter input for Logstash.

curl -XGET "http://localhost:9200/devoxx/tweet/_search" -d'
{
    "aggs" : {
        "hashtags" : {
            "terms" : { 
                "field" : "hashtag.text" 
            }
        }
    }
}'

Aggregations are requested using the aggs keyword, hashtags is a name I have chosen to identify the result and the terms aggregation counts the different terms for the given field (Disclaimer: For a sharded setup the terms aggregation might not be totally exact). This request might result in something like this:

"aggregations": {
      "hashtags": {
         "buckets": [
            {
               "key": "dartlang",
               "doc_count": 229
            },
            {
               "key": "java",
               "doc_count": 216
            },
[...]

The result is available for the name we have chosen. Aggregations put the counts into buckets that contain of a value and a count. This is very similar to how faceting works, only the names are different. For this example we can see that there are 229 documents for the hashtag dartlang and 216 containing the hashtag java.

This could also be done with facets alone but there is more: Aggregations can even be combined. You can now nest another aggregation in the first one that for every bucket will give you more buckets for another criteria.

curl -XGET "http://localhost:9200/devoxx/tweet/_search" -d'
{
    "aggs" : {
        "hashtags" : {
            "terms" : { 
                "field" : "hashtag.text" 
            },
            "aggs" : {
                "hashtagusers" : {
                    "terms" : {
                        "field" : "user.screen_name"
                    }
                }
            }
        }
    }
}'

We still request the terms aggregation for the hashtag. But now we have another aggregation embedded, a terms aggregation that processes the user name. This will then result in something like this.

               "key": "scala",
               "doc_count": 130,
               "hashtagusers": {
                  "buckets": [
                     {
                        "key": "jaceklaskowski",
                        "doc_count": 74
                     },
                     {
                        "key": "ManningBooks",
                        "doc_count": 3
                     },
    [...]

We can now see the users that have used a certain hashtext. In this case one user used one hashtag a lot. This is information that is not available that easily with queries and facets alone.

Besides the terms aggreagtion we have seen here there are also lots of other interesting aggregations available and more are added with every release. You can choose between bucket aggregations (like the terms aggregation) and metrics aggregations, that calculate values from the buckets, e.g. averages oder other statistical values.

Visualizing the Data

Besides the JSON output we have seen above, the data can also be used for visualizations. This is something that can then be prepared even for a non technical audience. Kibana is one of the options that is often used for logfile data but can be used for data of all kind, e.g. the Twitter data we have already seen above.

There are two bar charts that display the term frequencies for the mentions and the hashtags. We can already see easily which values are dominant. Also, the date histogram to the right shows at what time most tweets are sent. All in all these visualizations can provide a lot of value when it comes to trends that are only seen when combining the data.

The image shows Kibana 3, which still relies on the facet feature. Kibana 4 will instead provide access to the aggregations.

Conclusion

This post ends the series on use cases for Elasticsearch. I hope you enjoyed reading it and maybe you learned something new along the way. I can't spend that much time blogging anymore but new posts will be coming. Keep an eye on this blog.

Freitag, 19. September 2014

Use Cases for Elasticsearch: Index and Search Log Files

In the last posts we have seen some of the properties of using Elasticsearch as a document store, for searching text content and geospatial search. In this post we will look at how it can be used to index and store log files, a very useful application that can help developers and operations in maintaining applications.

Logging

When maintaining larger applications that are either distributed across several nodes or consist of several smaller applications searching for events in log files can become tedious. You might already have been in the situation that you have to find an error and need to log in to several machines and look at several log files. Using Linux tools like grep can be fun sometimes but there are more convenient ways. Elasticsearch and the projects Logstash and Kibana, commonly known as the ELK stack, can help you with this.

With the ELK stack you can centralize your logs by indexing them in Elasticsearch. This way you can use Kibana to look at all the data without having to log in on the machine. This can also make Operations happy as they don't have to grant access to every developer who needs to have access to the logs. As there is one central place for all the logs you can even see different applications in context. For example you can see the logs of your Apache webserver combined with the log files of your application server, e.g. Tomcat. As search is core to what Elasticsearch is doing you should be able to find what you are looking for even more quickly.

Finally Kibana can also help you with becoming more proactive. As all the information is available in real time you also have a visual representation of what is happening in your system in real time. This can help you in finding problems more quickly, e.g. you can see that some resource starts throwing Exceptions without having your customers report it to you.

The ELK Stack

For logfile analytics you can use all three applications of the ELK stack: Elasticsearch, Logstash and Kibana. Logstash is used to read and enrich the information from log files. Elasticsearch is used to store all the data and Kibana is the frontend that provides dashboards to look at the data.

The logs are fed into Elasticsearch using Logstash that combines the different sources. Kibana is used to look at the data in Elasticsearch. This setup has the advantage that different parts of the log file processing system can be scaled differently. If you need more storage for the data you can add more nodes to the Elasticsearch cluster. If you need more processing power for the log files you can add more nodes for Logstash.

Logstash

Logstash is a JRuby application that can read input from several sources, modify it and push it to a multitude of outputs. For running Logstash you need to pass it a configuration file that determines where the data is and what should be done with it. The configuration normally consists of an input and an output section and an optional filter section. This example takes the Apache access logs, does some predefined processing and stores them in Elasticsearch:

input {
  file {
    path => "/var/log/apache2/access.log"
  }
}

filter {
  grok {
    match => { message => "%{COMBINEDAPACHELOG}" }
  }
}

output {
  elasticsearch_http {
    host => "localhost"
  }
}

The file input reads the log files from the path that is supplied. In the filter section we have defined the grok filter that parses unstructured data and structures it. It comes with lots of predefined patterns for different systems. In this case we are using the complete Apache log pattern but there are also more basic building block like parsing email and ip addresses and dates (which can be lots of fun with all the different formats).

In the output section we are telling Logstash to push the data to Elasticsearch using http. We are using a server on localhost, for most real world setups this would be a cluster on separate machines.

Kibana

Now that we have the data in Elasticsearch we want to look at it. Kibana is a JavaScript application that can be used to build dashboards. It accesses Elasticsearch from the browser so whoever uses Kibana needs to have access to Elasticsearch.

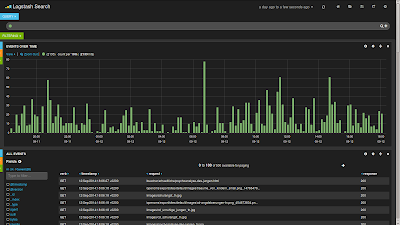
When using it with Logstash you can open a predefined dashboard that will pull some information from your index. You can then display charts, maps and tables for the data you have indexed. This screenshot displays a histogram and a table of log events but there are more widgets available like maps and pie and bar charts.

As you can see you can extract a lot of data visually that would otherwise be buried in several log files.

Conclusion

The ELK stack can be a great tool to read, modify and store log events. Dashboards help with visualizing what is happening. There are lots of inputs in Logstash and the grok filter supplies lots of different formats. Using those tools you can consolidate and centralize all your log files.

Lots of people are using the stack for analyzing their log file data. One of the articles that is available is by Mailgun, who are using it to store billions of events. And if that's not enough read this post on how CERN uses the ELK stack to help running the Large Hadron Collider

In the next post we will look at the final use case for Elasticsearch: Analytics.