Freitag, 12. Dezember 2014

Use Cases for Elasticsearch: Analytics

In the last post in this series we have seen how we can use Logstash, Elasticsearch and Kibana for doing logfile analytics. This week we will look at the general capabilities for doing analytics on any data using Elasticsearch and Kibana.

Use Case

We have already seen that Elasticsearch can be used to store large amounts of data. Instead of putting data into a data warehouse Elasticsearch can be used to do analytics and reporting. Another use case is social media data: Companies can look at what happens with their brand if they have the possibility to easily search it. Data can be ingested from multiple sources, e.g. Twitter and Facebook and combined in one system. Visualizing data in tools like Kibana can help with exploring large data sets. Finally mechanisms like Elasticsearchs Aggregations can help with finding new ways to look at the data.

Aggregations

Aggregations provide what the now deprecated facets have been providing but also a lot more. They can combine and count values from different documents and therefore show you what is contained in your data. For example if you have tweets indexed in Elasticsearch you can use the terms aggregation to find the most common hashtags. For details on indexing tweets in Elasticsearch see this post on the Twitter River and this post on the Twitter input for Logstash.

curl -XGET "http://localhost:9200/devoxx/tweet/_search" -d'
{
    "aggs" : {
        "hashtags" : {
            "terms" : { 
                "field" : "hashtag.text" 
            }
        }
    }
}'

Aggregations are requested using the aggs keyword, hashtags is a name I have chosen to identify the result and the terms aggregation counts the different terms for the given field (Disclaimer: For a sharded setup the terms aggregation might not be totally exact). This request might result in something like this:

"aggregations": {
      "hashtags": {
         "buckets": [
            {
               "key": "dartlang",
               "doc_count": 229
            },
            {
               "key": "java",
               "doc_count": 216
            },
[...]

The result is available for the name we have chosen. Aggregations put the counts into buckets that contain of a value and a count. This is very similar to how faceting works, only the names are different. For this example we can see that there are 229 documents for the hashtag dartlang and 216 containing the hashtag java.

This could also be done with facets alone but there is more: Aggregations can even be combined. You can now nest another aggregation in the first one that for every bucket will give you more buckets for another criteria.

curl -XGET "http://localhost:9200/devoxx/tweet/_search" -d'
{
    "aggs" : {
        "hashtags" : {
            "terms" : { 
                "field" : "hashtag.text" 
            },
            "aggs" : {
                "hashtagusers" : {
                    "terms" : {
                        "field" : "user.screen_name"
                    }
                }
            }
        }
    }
}'

We still request the terms aggregation for the hashtag. But now we have another aggregation embedded, a terms aggregation that processes the user name. This will then result in something like this.

               "key": "scala",
               "doc_count": 130,
               "hashtagusers": {
                  "buckets": [
                     {
                        "key": "jaceklaskowski",
                        "doc_count": 74
                     },
                     {
                        "key": "ManningBooks",
                        "doc_count": 3
                     },
    [...]

We can now see the users that have used a certain hashtext. In this case one user used one hashtag a lot. This is information that is not available that easily with queries and facets alone.

Besides the terms aggreagtion we have seen here there are also lots of other interesting aggregations available and more are added with every release. You can choose between bucket aggregations (like the terms aggregation) and metrics aggregations, that calculate values from the buckets, e.g. averages oder other statistical values.

Visualizing the Data

Besides the JSON output we have seen above, the data can also be used for visualizations. This is something that can then be prepared even for a non technical audience. Kibana is one of the options that is often used for logfile data but can be used for data of all kind, e.g. the Twitter data we have already seen above.

There are two bar charts that display the term frequencies for the mentions and the hashtags. We can already see easily which values are dominant. Also, the date histogram to the right shows at what time most tweets are sent. All in all these visualizations can provide a lot of value when it comes to trends that are only seen when combining the data.

The image shows Kibana 3, which still relies on the facet feature. Kibana 4 will instead provide access to the aggregations.

Conclusion

This post ends the series on use cases for Elasticsearch. I hope you enjoyed reading it and maybe you learned something new along the way. I can't spend that much time blogging anymore but new posts will be coming. Keep an eye on this blog.

Freitag, 19. September 2014

Use Cases for Elasticsearch: Index and Search Log Files

In the last posts we have seen some of the properties of using Elasticsearch as a document store, for searching text content and geospatial search. In this post we will look at how it can be used to index and store log files, a very useful application that can help developers and operations in maintaining applications.

Logging

When maintaining larger applications that are either distributed across several nodes or consist of several smaller applications searching for events in log files can become tedious. You might already have been in the situation that you have to find an error and need to log in to several machines and look at several log files. Using Linux tools like grep can be fun sometimes but there are more convenient ways. Elasticsearch and the projects Logstash and Kibana, commonly known as the ELK stack, can help you with this.

With the ELK stack you can centralize your logs by indexing them in Elasticsearch. This way you can use Kibana to look at all the data without having to log in on the machine. This can also make Operations happy as they don't have to grant access to every developer who needs to have access to the logs. As there is one central place for all the logs you can even see different applications in context. For example you can see the logs of your Apache webserver combined with the log files of your application server, e.g. Tomcat. As search is core to what Elasticsearch is doing you should be able to find what you are looking for even more quickly.

Finally Kibana can also help you with becoming more proactive. As all the information is available in real time you also have a visual representation of what is happening in your system in real time. This can help you in finding problems more quickly, e.g. you can see that some resource starts throwing Exceptions without having your customers report it to you.

The ELK Stack

For logfile analytics you can use all three applications of the ELK stack: Elasticsearch, Logstash and Kibana. Logstash is used to read and enrich the information from log files. Elasticsearch is used to store all the data and Kibana is the frontend that provides dashboards to look at the data.

The logs are fed into Elasticsearch using Logstash that combines the different sources. Kibana is used to look at the data in Elasticsearch. This setup has the advantage that different parts of the log file processing system can be scaled differently. If you need more storage for the data you can add more nodes to the Elasticsearch cluster. If you need more processing power for the log files you can add more nodes for Logstash.

Logstash

Logstash is a JRuby application that can read input from several sources, modify it and push it to a multitude of outputs. For running Logstash you need to pass it a configuration file that determines where the data is and what should be done with it. The configuration normally consists of an input and an output section and an optional filter section. This example takes the Apache access logs, does some predefined processing and stores them in Elasticsearch:

input {
  file {
    path => "/var/log/apache2/access.log"
  }
}

filter {
  grok {
    match => { message => "%{COMBINEDAPACHELOG}" }
  }
}

output {
  elasticsearch_http {
    host => "localhost"
  }
}

The file input reads the log files from the path that is supplied. In the filter section we have defined the grok filter that parses unstructured data and structures it. It comes with lots of predefined patterns for different systems. In this case we are using the complete Apache log pattern but there are also more basic building block like parsing email and ip addresses and dates (which can be lots of fun with all the different formats).

In the output section we are telling Logstash to push the data to Elasticsearch using http. We are using a server on localhost, for most real world setups this would be a cluster on separate machines.

Kibana

Now that we have the data in Elasticsearch we want to look at it. Kibana is a JavaScript application that can be used to build dashboards. It accesses Elasticsearch from the browser so whoever uses Kibana needs to have access to Elasticsearch.

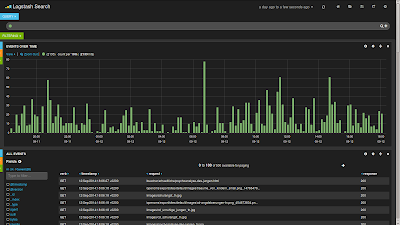
When using it with Logstash you can open a predefined dashboard that will pull some information from your index. You can then display charts, maps and tables for the data you have indexed. This screenshot displays a histogram and a table of log events but there are more widgets available like maps and pie and bar charts.

As you can see you can extract a lot of data visually that would otherwise be buried in several log files.

Conclusion

The ELK stack can be a great tool to read, modify and store log events. Dashboards help with visualizing what is happening. There are lots of inputs in Logstash and the grok filter supplies lots of different formats. Using those tools you can consolidate and centralize all your log files.

Lots of people are using the stack for analyzing their log file data. One of the articles that is available is by Mailgun, who are using it to store billions of events. And if that's not enough read this post on how CERN uses the ELK stack to help running the Large Hadron Collider

In the next post we will look at the final use case for Elasticsearch: Analytics.

Freitag, 29. August 2014

Use Cases for Elasticsearch: Geospatial Search

In the previous posts we have seen that Elasticsearch can be used to store documents in JSON format and distribute the data across multiple nodes as shards and replicas. Lucene, the underlying library, provides the implementation of the inverted index that can be used to search the documents. Analyzing is a crucial step for building a good search application.

In this post we will look at a different feature that can be used for applications you would not immediately associate Elasticsearch with. We will look at the geo features that can be used to build applications that can filter and sort documents based on the location of the user.

Locations in Applications

Location based features can be useful for a wide range of applications. For merchants the web site can present the closest point of service for the current user. Or there is a search facility for finding points of services according to a location, often integrated with something like Google Maps. For classifieds it can make sense to sort them by distance from the user searching, the same is true for any search for locations like restaurants and the like. Sometimes it also makes sense to only show results that are in a certain area around me, in this case we need to filter by distance. Probably the user is looking for a new appartment and is not interested in results that are too far away from his workplace. Finally locations can also be of interest when doing analytics. Social media data can tell you where something interesting is happening just by looking at the amount of status messages sent from a certain area.

Most of the time locations are stored as a pair of latitude and longitude, which denotes a point. The combination of 48.779506, 9.170045 for example points to Liederhalle Stuttgart which happens to be the location for Java Forum Stuttgart. Geohashes are an alternative means to encode latitude and longitude. They can be stored in arbitrary precision so those can also refer to a larger area instead of a point.

When calculating a Geohash the map is divided into several buckets or cells. Each bucket is identified by a base 32 encoded value. The complete geohash then consists of a sequence of characters. Each following character marks the bucket in the previous bucket so you are zooming in to the location. The longer the geohash string the more precise the location is. For example u0wt88j3jwcp is the geohash for Liederhalle Stuttgart. The prefix u0wt on the other hand is the area of Stuttgart and some of the surrounding cities.

The hierarchical nature of geohashes and the possiblity to express them as strings makes them a good choice for storing them in the inverted index. You can create geohashes using the original geohash service or more visually appealing using the nice GeohashExplorer.

Locations in Elasticsearch

Elasticsearch accepts lat and lon for specifying latitude and longitude. These are two documents for a conference in Stuttgart and one in Nuremberg.

{
    "title" : "Anwendungsfälle für Elasticsearch",
    "speaker" : "Florian Hopf",
    "date" : "2014-07-17T15:35:00.000Z",
    "tags" : ["Java", "Lucene"],
    "conference" : {
        "name" : "Java Forum Stuttgart",
        "city" : "Stuttgart",
            "coordinates": {
                "lon": "9.170045",
                "lat": "48.779506"
            }
    } 
}
{
    "title" : "Anwendungsfälle für Elasticsearch",
    "speaker" : "Florian Hopf",
    "date" : "2014-07-15T16:30:00.000Z",
    "tags" : ["Java", "Lucene"],
    "conference" : {
        "name" : "Developer Week",
        "city" : "Nürnberg",
            "coordinates": {
                "lon": "11.115358",
                "lat": "49.417175"
            }
    } 
}

Alternatively you can use the GeoJSON format, accepting an array of longitude and latitude. If you are like me be prepared to hunt down why queries aren't working just to notice that you messed up the order in the array.

The field needs to be mapped with a geo_point field type.

{
    "properties": {
          […],
       "conference": {
            "type": "object",
            "properties": {
                "coordinates": {
                    "type": "geo_point",
                    "geohash": "true",
                    "geohash_prefix": "true"
                }
            }
       }
    }
}'

By passing the optional attribute geohash Elasticsearch will automatically store the geohash for you as well. Depending on your usecase you can also store all the parent cells of the geohash using the parameter geohash_prefix. As the values are just strings this is a normal ngram index operation which stores the different substrings for a term, e.g. u, u0, u0w and u0wt for u0wt.

With our documents in place we can now use the geo information for sorting, filtering and aggregating results.

Sorting by Distance

First, let's sort all our documents by distance from a point. This would allow us to build an application that displays the closest location for the current user.

curl -XPOST "http://localhost:9200/conferences/_search " -d'
{
    "sort" : [
        {
            "_geo_distance" : {
                "conference.coordinates" : {
                    "lon": 8.403697,
                    "lat": 49.006616
                },
                "order" : "asc",
                "unit" : "km"
            }
        }
    ]
}'

We are requesting to sort by _geo_distance and are passing in another location, this time Karlsruhe, where I live. Results should be sorted ascending so the closer results come first. As Stuttgart is not far from Karlsruhe it will be first in the list of results.

The score for the document will be empty. Instead there is a field sort that contains the distance of the locations from the one provided. This can be really handy when displaying the results to the user.

Filtering by Distance

For some usecase we would like to filter our results by distance. Some online real estate agencies for example provide the option to only display results that are in a certain distance from a point. We can do the same by passing in a geo_distance filter.

curl -XPOST "http://localhost:9200/conferences/_search" -d'
{
   "filter": {
      "geo_distance": {
         "conference.coordinates": {
            "lon": 8.403697,
            "lat": 49.006616
         },
         "distance": "200km",
         "distance_type": "arc"
      }
   }
}'

We are again passing the location of Karlsruhe. We request that only documents in a distance of 200km should be returned and that the arc distance_type should be used for calculating the distance. This will take into account that we are living on a globe.

The resulting list will only contain one document, Stuttgart, as Nuremberg is just over 200km away. If we use the distance 210km both of the documents will be returned.

Geo Aggregations

Elasticsearch provides several useful geo aggregations that allow you to retrieve more information on the locations of your documents, e.g. for faceting. On the other hand as we do have the geohash as well as the prefix enabled we can retrieve all of the cells our results are in using a simple terms aggregation. This way you can let the user drill down on the results by filtering on the cell.

curl -XPOST "http://localhost:9200/conferences/_search" -d'
{
    "aggregations" : {
        "conference-hashes" : {
            "terms" : {
                "field" : "conference.coordinates.geohash"
            }
        }
    }
}'

Depending on the precision we have chosen while indexing this will return a long list of prefixes for hashes but the most important part is at the beginning.

[...]
   "aggregations": {
      "conference-hashes": {
         "buckets": [
            {
               "key": "u",
               "doc_count": 2
            },
            {
               "key": "u0",
               "doc_count": 2
            },
            {
               "key": "u0w",
               "doc_count": 1
            },
            [...]
        }
    }

Stuttgart and Nuremberg both share the parent cells u and u0.

Alternatively to the terms aggregation you can also use specialized geo aggregations, e.g. the geo distance aggregation for forming buckets of distances.

Conclusion

Besides the features we have seen here Elasticsearch offers a wide range of geo features. You can index shapes and query by arbitrary polygons, either by passing them in or by passing a reference of an indexed polygon. When geohash prefixes are turned on you can also filter by geohash cell.

With the new HTML 5 location features location aware search and content delivery will become more important. Elasticsearch is a good fit for building this kind of applications.

Two users in the geo space are Foursquare, a very early user of Elasticsearch, and Gild, a recruitment agency that does some magic with locations.

Mittwoch, 13. August 2014

Resources for Freelancers

More than half a year ago I wrote a post on my first years as a freelancer. While writing the post I noticed that there are quite some resources I would like to recommend which I deferred to another post that never was written. Last weekend at SoCraTes we had a very productive session on freelancing. We talked about different aspects from getting started, kinds of and reasons for freelancing to handling your sales pipeline.

David and me recommended some resources on getting started so this is the perfect excuse to write the post I planned to write initially.

I will keep it minimal and only present a short description of each point.

Softwerkskammer Freelancer Group
Our discussion at SoCraTes lead to founding a new group in the Softwerkskammer community. We plan to exchange knowledge and probably even work opportunities.
The Freelancers' Show
A podcast on everything freelancing. Started as the Ruby Freelancers but the topics always were general. Fun to listen to, when it comes to software development you might also want to listen to the Ruby Rogues.
Book Yourself Solid
I read this when getting started with freelancing. Helps you with deciding what you want to do and with marketing yourself.
Get Clients Now
A workbook with daily tasks for improving your business. It's a 28 day program that contains some really good ideas and helps you working on getting more work.
Duct Tape Marketing
A book on improving your marketing activities. I took less out of this book than the other two.
Email Course by Eric Davis
Eric Davis, one of the hosts of the Freelancers' Show also provides a free email course for freelancers.
Mediafon Ratgeber Selbstständige
A German book on all practical issues you have to take care of.

There is also stuff that is only slightly related to freelancing but helped me on the way, either through learning or motivation.

Technical Blogging
A book that can help you getting started with blogging. Can be motivating but also contains some good tips.
My Blog Traffic Sucks.
A short book on blogging. This book lead to my very frequent blog publishing habit.
Confessions of a Public Speaker
A very good and entertaining read on presenting.
The 100$ Startup
Not exactly about freelancing but about small startups of all kinds, a very entertaining read about people working for themselves.

I am sure I forgot some of the things that helped me but I hope one of the resources can help you and your freelancing business. If you are missing something feel free to leave a comment.

Mittwoch, 30. Juli 2014

Scrapy and Elasticsearch

On 29.07.2014 I gave a talk at Search Meetup Karlsruhe on using Scrapy with Elasticsearch, the slides are here. This post evolved from the talk and introduces you to web scraping and search with Scrapy and Elasticsearch.

Web Crawling

You might think that web crawling and scraping only is for search engines like Google and Bing. But a lot of companies are using it for different purposes: Price comparison, financial risk information and portals all need a way to get the data. And at least sometimes the way is to retrieve it through some public website. Besides these cases where the data is not in your hand it can also make sense if the data is aggregated already. For intranet and portal search engines it can be easier to just scrape the frontend instead of building data import facilities for different, sometimes even old systems.

The Example

In this post we are looking at a rather artificial example: Crawling the meetup.com page for recent meetups to make them available for search. Why artificial? Because meetup.com has an API that provides all the data in a more convenient way. But imagine there is no other way and we would like to build a custom search on this information, probably by adding other event sites as well.

This is a part of the Search Meetup Karlsruhe page that displays the recent meetups.

We can see that there is already some information we are interested in like the title and the link to the meetup page.

Roll Your Own?

When deciding on doing web scraping you might be tempted to build it yourself using a script or some code. How hard can it be to fetch a website, parse its source and extract all links to follow?

For demoing some of the features of Akka I have built a simple web crawler that visits a website, follows all links and indexes the content in Lucene. While this is not a lot of code you will notice soon that it is not suited for real world uses: It is hammering the crawled page with as many requests as possible. There is no way to make it behave nicely by respecting the robots.txt. Additional processing of the content is too hard to add afterwards. All of this is enough to lean to a ready made solution.

Scrapy

Scrapy is a framework for building crawlers and process the extracted data. It is implemented in Python and does asynchronous, non-blocking networking. It is easily extendable, not only via the item pipeline the content flows through. Finally it already comes with lots of features that you might have to build yourself otherwise.

In Scrapy you implement a spider, that visits a certain page and extracts items from the content. The items then flow through the item pipeline and get dumped to a Feed Exporter that then writes the data to a file. At every stage of the process you can add custom logic.

This is a very simplified diagram that doesn't take the asynchronous nature of Scrapy into account. See the Scrapy documentation for a more detailed view.

For installing Scrapy I am using pip which should be available for all systems. You can then run pip install scrapy to get it.

To get started using Scrapy you can use the scaffolding feature to create a new project. Just issue something like scrapy startproject meetup and scrapy will generate quite some files for you.

meetup/
meetup/scrapy.cfg
meetup/meetup
meetup/meetup/settings.py
meetup/meetup/__init__.py
meetup/meetup/items.py
meetup/meetup/pipelines.py
meetup/meetup/spiders
meetup/meetup/spiders/__init__.py

For now we can concentrate on the items.py, that describes the strucure of the data to crawl, and the spiders directory where we can put our spiders.

Our First Spider

First we need to define what data structure we would like to retrieve. This is described as an Item that is then created using a Spider and flows through the item pipeline. For our case we can put this into items.py

from scrapy.item import Item, Field

class MeetupItem(Item):
    title = Field()
    link = Field()
    description = Field()

Our MeetupItem defines three fields for the title, the link and a description we can search on. For real world usecases this would contain more information like the date and time or probably more information on the participants.

To fetch data and create Items we need to implement a Spider instance. We create a file meetup_spider.py in the spiders directory.

from scrapy.spider import BaseSpider
from scrapy.selector import Selector
from meetup.items import MeetupItem

class MeetupSpider(BaseSpider):
    name = "meetup"
    allowed_domains = ["meetup.com"]
    start_urls = [
        "http://www.meetup.com/Search-Meetup-Karlsruhe/"
    ]

    def parse(self, response):
        responseSelector = Selector(response)
        for sel in responseSelector.css('li.past.line.event-item'):
            item = MeetupItem()
            item['title'] = sel.css('a.event-title::text').extract()
            item['link'] = sel.xpath('a/@href').extract()
            yield item

Our spider extends BaseSpider and defines a name, the allowed domains and a start url. Scrapy calls the start url and passes the response to the parse method. We are then using a Selector to parse the data using eiher css or xpath. Both is shown in the example above.

Every Item we create is returned from the method. If we would have to visit another page we could also return a Request object and Scrapy would then visit that page as well.

We can run this spider from the project directory by issuing scrapy crawl meetup -o talks.json. This will use our meetup spider and write the items as JSON to a file.

2014-07-24 18:27:59+0200 [scrapy] INFO: Scrapy 0.20.0 started (bot: meetup)
[...]
2014-07-24 18:28:00+0200 [meetup] DEBUG: Crawled (200) <get http:="" www.meetup.com="" search-meetup-karlsruhe=""> (referer: None)
2014-07-24 18:28:00+0200 [meetup] DEBUG: Scraped from <200 http://www.meetup.com/Search-Meetup-Karlsruhe/>
        {'link': [u'http://www.meetup.com/Search-Meetup-Karlsruhe/events/178746832/'],
         'title': [u'Neues in Elasticsearch 1.1 und Logstash in der Praxis']}
2014-07-24 18:28:00+0200 [meetup] DEBUG: Scraped from <200 http://www.meetup.com/Search-Meetup-Karlsruhe/>
        {'link': [u'http://www.meetup.com/Search-Meetup-Karlsruhe/events/161417512/'],
         'title': [u'Erstes Treffen mit Kurzvortr\xe4gen']}
2014-07-24 18:28:00+0200 [meetup] INFO: Closing spider (finished)
2014-07-24 18:28:00+0200 [meetup] INFO: Stored jsonlines feed (2 items) in: talks.json
2014-07-24 18:28:00+0200 [meetup] INFO: Dumping Scrapy stats:
        {'downloader/request_bytes': 244,
         'downloader/request_count': 1,
[...]
         'start_time': datetime.datetime(2014, 7, 24, 16, 27, 59, 540300)}
2014-07-24 18:28:00+0200 [meetup] INFO: Spider closed (finished)
                    </get>

You can see that Scrapy visited the page and extracted two items. Finally it prints some stats on the crawl. The file contains our items as well

{"link": ["http://www.meetup.com/Search-Meetup-Karlsruhe/events/178746832/"], "title": ["Neues in Elasticsearch 1.1 und Logstash in der Praxis"]}
{"link": ["http://www.meetup.com/Search-Meetup-Karlsruhe/events/161417512/"], "title": ["Erstes Treffen mit Kurzvortr\u00e4gen"]}

This is fine but there is a problem. We don't have all the data that we would like to have, we are missing the description. This information is not fully available on the overview page so we need to crawl the detail pages of the meetup as well.

The Crawl Spider

We still need to use our overview page because this is where all the recent meetups are listed. But for retrieving the item data we need to go to the detail page.

As mentioned already we could solve our new requirement using our spider above by returning Request objects and a new callback function. But we can solve it another way, by using the CrawlSpider that can be configured with a Rule that advices where to extract links to visit.

In case you are confused, welcome to the world of Scrapy! When working with Scrapy you will regularly find cases where there are several ways to do a thing.

from scrapy.contrib.spiders import CrawlSpider, Rule
from scrapy.contrib.linkextractors.sgml import SgmlLinkExtractor
from scrapy.selector import Selector
from meetup.items import MeetupItem

class MeetupDetailSpider(CrawlSpider):
    name = "meetupDetail"
    allowed_domains = ["meetup.com"]
    start_urls = ["http://www.meetup.com/Search-Meetup-Karlsruhe/"]
    rules = [Rule(SgmlLinkExtractor(restrict_xpaths=('//div[@id="recentMeetups"]//a[@class="event-title"]')), callback='parse_meetup')]

    def parse_meetup(self, response):
        sel = Selector(response)
        item = MeetupItem()
        item['title'] = sel.xpath('//h1[@itemprop="name"]/text()').extract()
        item['link'] = response.url
        item['description'] = sel.xpath('//div[@id="past-event-description-wrap"]//text()').extract()
        yield item

Besides the information we have set for our other spider we now also add a Rule object. It extracts the links from the list and passes the responses to the supplied callback. You can also add rules that visit links by path, e.g. all with the fragment /articles/ in the url.

Our parse_meetup method now doesn't work on the overview page but on the detail pages that are extracted by the rule. The detail page has all the information available we need and will now even pass the description to our item.

Now that we have all the information we can do something useful with it: Index it in Elasticsearch.

Elasticsearch

Elasticsearch support for Scrapy is available by installing a module: pip install "ScrapyElasticSearch". It takes the Items created by your spider and indexes those in Elasticsearch using the library pyes.

Looking at the Scrapy architecture above you might expect that the module is implemented as a FeedExporter that exports the items to Elasticsearch instead of the filesystem. For reasons unknown to me exporting to a database or search engine is done using an ItemPipeline which is a component in the item pipeline. Confused?

To configure Scrapy to put the items to Elasticsearch of course you need to have an instance running somewhere. The pipeline is configured in the file settings.py.

ITEM_PIPELINES = [
  'scrapyelasticsearch.ElasticSearchPipeline',
]

ELASTICSEARCH_SERVER = 'localhost' 
ELASTICSEARCH_PORT = 9200 
ELASTICSEARCH_INDEX = 'meetups'
ELASTICSEARCH_TYPE = 'meetup'
ELASTICSEARCH_UNIQ_KEY = 'link'

The configuration should be straightforward. We enable the module by adding it to the ITEM_PIPELINES and configure additional information like the host, index and type name. Now when crawling for the next time Scrapy will automatically push your data to Elasticsearch.

I am not sure if this can be an issue when it comes to crawling but the module doesn't use bulk indexing but indexes each item by itself. If you have a very large amount of data this could be a problem but should be totally fine for most uses. Also, of course you need to make sure that your mapping is in place before indexing data if you need some predefined handling.

Conclusion

I hope you could see how useful Scrapy can be and how easy it is to put the data in stores like Elasticsearch. Some approaches of Scrapy can be quite confusing at first but nevertheless it's an extremely useful tool. Give it a try the next time you are thinking about web scraping.

Freitag, 25. Juli 2014

Use Cases for Elasticsearch: Flexible Query Cache

In the previous two posts on use cases for Elasticsearch we have seen that Elasticsearch can be used to store even large amounts of documents and that we can access those using the full text features of Lucene via the Query DSL. In this shorter post we will put both of use cases together to see how read heavy applications can benefit from Elasticsearch.

Search Engines in Classic Applications

Looking at classic applications search engines were a specialized thing that was only responsible for helping with one feature, the search page.

On the left we can see our application, most of its functionality is build by querying the database. The search engine only plays a minor part and is responsible for rendering the search page.

Databases are well suited for lots of types of applications but it turns out that often it is not that easy to scale them. Websites with high traffic peaks often have some problems scaling database access. Indexing and scaling machines up can help but often requires specialized knowledge and can become rather expensive.

As with other search features especially ecommerce providers started doing something different. They started to employ the search engine not only for full text search but also for other parts of the page that require no direct keyword input by the user. Again, let's have a look at a page at Amazon.

This is one of the category pages that can be accessed using the navigation. We can already see that the interface looks very similar to a search result page. There is a result list, we can sort and filter the results using the facets. Though of course I have no insight how Amazon is doing this exactly a common approach is to use the search engine for pages like this as well.

Scaling Read Requests

A common problem for ecommerce websites is that there are huge traffic spikes. Depending on your kind of business you might have a lot more traffic just before christmas. Or you might have to fight spikes when there are TV commercials for your service or any special discounts. Flash sale sites are at the extreme end of those kind of sites with very high spikes at a certain point in time when a sale starts.

It turns out that search engines are good at being queried a lot. The immutable data set, the segments, are very cache friendly. When it comes to filters those can be cached by the engine as well most of the times. On a warm index most of the data will be in RAM so it is lightning fast.

Back to our example of talks that can be accessed online. Imagine a navigation where the user can choose the city she wants to see events for. You can then issue a query like this to Elasticsearch:

curl -XPOST "http://localhost:9200/conferences/_search " -d'
{
    "filter": {
        "term": {
           "conference.city": "stuttgart"
        }
    }
}'

There is no query part but only a filter that limits the results to the talks that are in Stuttgart. The whole filter will be cached so if a lot of users are accessing the data there can be a huge performance gain for you and especially your users.

Additionally as we have seen new nodes can be added to Elasticsearch without a lot of hassle. If we need more query capacity we can easily add more machines and more replicas, even temporarily. When we can identify some pages that can be moved to the search engine the database doesn't need to have that much traffic anymore.

Especially for getting the huge spikes under control it is best to try to not access the database anymore for read heavy pages and deliver all of the content from the search engine.

Conclusion

Though in this post we have looked at ecommerce the same strategy can be applied to different domains. Content management systems can push the editorial content to search engines and let those be responsible for scaling. Classifieds, social media aggregation, .... All of those can benefit from the cache friendly nature of a search engine. Maybe you will even notice that parts of your data don't need to be in the database at all and you can migrate them to Elasticsearch as a primary data store. A first step to polyglot persistence.

Dienstag, 15. Juli 2014

Slides for Use Cases for Elasticsearch for Developer Week and Java Forum Stuttgart

I am giving the German talk Anwendungsfälle für Elasticsearch (Use Cases for Elasticsearch) twice in July 2014, first at Developer Week Nürnberg at 15.07.2014 and then at Java Forum Stuttgart at 17.07.2014. The slides for the Developer Week talk, which are a superset of the Java Forum talk, are now available on Slideshare.

In additon to the talks I published a blog post on each of the use cases.

If you are interested in all posts on this blog you can subscribe to my feed.

If you have any feedback on the talk or the topic I would appreciate a comment or you can just contact me directly.

Freitag, 11. Juli 2014

Use Cases for Elasticsearch: Full Text Search

In the last post of this series on use cases for Elasticsearch we looked at the features Elasticsearch provides for storing even large amounts of documents. In this post we will look at another one of its core features: Search. I am building on some of the information in the previous post so if you haven't read it you should do so now.

As we have seen we can use Elasticsearch to store JSON documents that can even be distributed across several machine. Indexes are used to group documents and each document is stored using a certain type. Shards are used to distribute parts of an index across several nodes and replicas are copies of shards that are used for distributing load as well as for fault tolerance.

Full Text Search

Everybody uses full text search. The amount of information has just become too much to access it using navigation and categories alone. Google is the most prominent example offering instant keyword search across a huge amount of information.

Looking at what Google does we can already see some common features of full text search. Users only provide keywords and expect the search engine to provide good results. Relevancy of documents is expected to be good and users want the results they are looking for on the first page. How relevant a document is can be influenced by different factors like h the queried term exists in a document. Besides getting the best results the user wants to be supported during the search process. Features like suggestions and highlighting on the result excerpt can help with this.

Another area where search is important is E-Commerce with Amazon being one of the dominant players.

The interface looks similar to the Google one. The user can enter keywords that are then searched for. But there are also slight differences. The suggestions Amazon provides are more advanced, also hinting at categories a term might be found in. Also the result display is different, consisting of a more structured view. The structure of the documents being searched is also used for determining the facets on the left that can be used to filter the current result based on certain criteria, e.g. all results that cost between 10 and 20 €. Finally, relevance might mean something completely different when it comes to something like an online store. Often the order of the result listing is influenced by the vendor or the user can sort the results by criteria like price or release date.

Though neither Google nor Amazon are using Elasticsearch you can use it to build similar solutions.

Searching in Elasticsearch

As with everything else, Elasticsearch can be searched using HTTP. In the most simple case you can append the _search endpoint to the url and add a parameter: curl -XGET "http://localhost:9200/conferences/talk/_search?q=elasticsearch&pretty=true". Elasticsearch will then respond with the results, ordered by relevancy.

{
  "took" : 81,
  "timed_out" : false,
  "_shards" : {
    "total" : 5,
    "successful" : 5,
    "failed" : 0
  },
  "hits" : {
    "total" : 1,
    "max_score" : 0.067124054,
    "hits" : [ {
      "_index" : "conferences",
      "_type" : "talk",
      "_id" : "iqxb7rDoTj64aiJg55KEvA",
      "_score" : 0.067124054,
      "_source":{
    "title" : "Anwendungsfälle für Elasticsearch",
    "speaker" : "Florian Hopf",
    "date" : "2014-07-17T15:35:00.000Z",
    "tags" : ["Java", "Lucene"],                                  
    "conference" : {
        "name" : "Java Forum Stuttgart",
        "city" : "Stuttgart"
    }
}

    } ]
  }
}

Though we have searched on a certain type now you can also search multiple types or multiple indices.

Adding a parameter is easy but search requests can become more complex. We might request highlighting or filter the documents according to a criteria. Instead of using parameters for everything Elasticsearch offers the so called Query DSL, a search API that is passed in the body of the request and is expressed using JSON.

This query could be the result of a user trying to search for elasticsearch but mistyping parts of it. The results are filtered so that only talks for conferences in the city of Stuttgart are returned.

curl -XPOST "http://localhost:9200/conferences/_search " -d'
{
    "query": {
        "match": {
            "title" : {
               "query": "elasticsaerch",
               "fuzziness": 2
            }
        }
    },
    "filter": {
        "term": {
           "conference.city": "stuttgart"
        }
    }
}'

This time we are querying all documents of all types in the index conferences. The query object requests one of the common queries, a match query on the title field of the document. The query attribute contains the search term that would be passed in by the user. The fuzziness attribute requests that we should also find documents that contain terms that are similar to the term requested. This will take care of the misspelled term and also return results containing elasticsearch. The filter object requests that all results should be filtered according to the city of the conference. Filters should be used whenever possible as they can be cached and do not calculate the relevancy which should make them faster.

Normalizing Text

As search is used everywhere users also have some expectations of how it should work. Instead of issuing exact keyword matches they might use terms that are only similar to the ones that are in the document. For example a user might be querying for the term Anwendungsfall which is the singular of the contained term Anwendungsfälle, meaning use cases in German: curl -XGET "http://localhost:9200/conferences/talk/_search?q=title:anwendungsfall&pretty=true"

{
  "took" : 2,
  "timed_out" : false,
  "_shards" : {
    "total" : 5,
    "successful" : 5,
    "failed" : 0
  },
  "hits" : {
    "total" : 0,
    "max_score" : null,
    "hits" : [ ]
  }
}

No results. We could try to solve this using the fuzzy search we have seen above but there is a better way. We can normalize the text during indexing so that both keywords point to the same term in the document.

Lucene, the library search and storage in Elasticsearch is implemented with provides the underlying data structure for search, the inverted index. Terms are mapped to the documents they are contained in. A process called analyzing is used to split the incoming text and add, remove or modify terms.

On the left we can see two documents that are indexed, on the right we can see the inverted index that maps terms to the documents they are contained in. During the analyzing process the content of the documents is split and transformed in an application specific way so it can be put in the index. Here the text is first split on whitespace or punctuation. Then all the characters are lowercased. In a final step the language dependent stemming is employed that tries to find the base form of terms. This is what transforms our Anwendungsfälle to Anwendungsfall.

What kind of logic is executed during analyzing depends on the data of your application. The analyzing process is one of the main factors for determining the quality of your search and you can spend quite some time with it. For more details you might want to look at my post on the absolute basics of indexing data.

In Elasticsearch, how fields are analyzed is determined by the mapping of the type. Last week we have seen that we can index documents of different structure in Elasticsearch but as we can see now Elasticsearch is not exactly schema free. The analyzing process for a certain field is determined once and cannot be changed easily. You can add additional fields but you normally don't change how existing fields are stored.

If you don't supply a mapping Elasticsearch will do some educated guessing for the documents you are indexing. It will look at any new field it sees during indexing and do what it thinks is best. In the case of our title it uses the StandardAnalyzer because it is a string. Elasticsearch does not know what language our string is in so it doesn't do any stemming which is a good default.

To tell Elasticsearch to use the GermanAnalyzer instead we need to add a custom mapping. We first delete the index and create it again:

curl -XDELETE "http://localhost:9200/conferences/"

curl -XPUT "http://localhost:9200/conferences/“

We can then use the PUT mapping API to pass in the mapping for our type.

curl -XPUT "http://localhost:9200/conferences/talk/_mapping" -d'
{
    "properties": {
       "tags": {
          "type": "string",
          "index": "not_analyzed"
       },
       "title": {
          "type": "string",
          "analyzer": "german"
       }
    }
}'

We have only supplied a custom mapping for two fields. The rest of the fields will again be guessed by Elasticsearch. When creating a production app you will most likely map all of your fields in advance but the ones that are not that relevant can also be mapped automatically. Now, if we index the document again and search for the singular, the document will be found.

Advanced Search

Besides the features we have seen here Elasticsearch provides a lot more. You can automatically gather facets for the results using aggregations which we will look at in a later post. The suggesters can be used to perform autosuggestion for the user, terms can be highlighted, results can be sorted according to fields, you get pagination with each request, .... As Elasticsearch builds on Lucene all the goodies for building an advanced search application are available.

Conclusion

Search is a core part of Elasticsearch that can be combined with its distributed storage capabilities. You can use to Query DSL to build expressive queries. Analyzing is a core part of search and can be influenced by adding a custom mapping for a type. Lucene and Elasticsearch provide lots of advanced features for adding search to your application.

Of course there are lots of users that are building on Elasticsearch because of its search features and its distributed nature. GitHub uses it to let users search the repositories, StackOverflow indexes all of its questions and answers in Elasticsearch and SoundCloud offers search in the metadata of the songs.

In the next post we will look at another aspect of Elasticsearch: Using it to index geodata, which lets you filter and sort results by postition and distance.

Freitag, 4. Juli 2014

Use Cases for Elasticsearch: Document Store

I'll be giving an introductory talk about Elasticsearch twice in July, first at Developer Week Nürnberg, then at Java Forum Stuttgart. I am showing some of the features of Elasticsearch by looking at certain use cases. To prepare for the talks I will try to describe each of the use cases in a blog post as well.

When it comes to Elasticsearch the first thing to look at often is the search part. But in this post I would like to start with its capabilities as a distributed document store.

Getting Started

Before we start we need to install Elasticsearch which fortunately is very easy. You can just download the archive, unpack it and use a script to start it. As it is a Java based application you of course need to have a Java runtime installed.

# download archive
wget https://download.elasticsearch.org/elasticsearch/elasticsearch/elasticsearch-1.2.1.zip
 
# zip is for windows and linux
unzip elasticsearch-1.2.1.zip
 
# on windows: elasticsearch.bat
elasticsearch-1.2.1/bin/elasticsearch

Elasticsearch can be talked to using HTTP and JSON.When looking around at examples you will often see curl being used because it is widely available. (See this post on querying Elasticsearch using plugins for alternatives). To see if it is up and running you can issue a GET request on port 9200: curl -XGET http://localhost:9200. If everything is set up correctly Elasticsearch will respond with something like this:

{
 "status" : 200,"name" : "Hawkeye", 
 "version" : {
  "number" : "1.2.1",
  "build_hash" : "6c95b759f9e7ef0f8e17f77d850da43ce8a4b364",
  "build_timestamp" : "2014-06-03T15:02:52Z",
     "build_snapshot" : false,
     "lucene_version" : "4.8"
  },
  "tagline" : "You Know, for Search"
}

Storing Documents

When I say document this means two things. First, Elasticsearch stores JSON documents and even uses JSON internally a lot. This is an example of a simple document that describes talks for conferences.

{
    "title" : "Anwendungsfälle für Elasticsearch",
    "speaker" : "Florian Hopf",
    "date" : "2014-07-17T15:35:00.000Z",
    "tags" : ["Java", "Lucene"],
    "conference" : {
        "name" : "Java Forum Stuttgart",
        "city" : "Stuttgart"
    } 
}

There are fields and values, arrays and nested documents. Each of those features is supported by Elasticsearch.

Besides the JSON documents that are used for storing data in Elasticsearch, document refers to the underlying library Lucene, that is used to persist the data and handles data as documents consisting of fields. So this is a perfect match: Elasticsearch uses JSON, which is very popular and supported from lots of technologies. But the underlying data structures also use documents.

When indexing a document we can issue a post request to a certain URL. The body of the request contains the document to be stored, the file we are passing contains the content we have seen above.

curl -XPOST http://localhost:9200/conferences/talk/ --data-binary @talk-example-jfs.json

When started Elasticsearch listens on port 9200 by default. For storing information we need to provide some additional information in the URL. The first segment after the port is the index name. An index name is a logical grouping of documents. If you want to compare it to the relational world this can be thought of as the database.

The next segment that needs to be provided is the type. A type can describe the structure of the doucments that are stored in it. You can again compare this to the relational world, this could be a table, but that is only slightly correct. Documents of any kind can be stored in Elasticsearch, that is why it is often called schema free. We will look at this behaviour in the next post where you will see that schema free isn't the most appropriate term for it. For now it is enough to know that you can store documents with completely different structure in Elasticsearch. This also means you can evolve your documents and add new fields as appropriate.

Note that neither index nor type need to exist when starting indexing documents. They will be created automatically, one of the many features that makes it so easy to start with Elasticsearch.

When you are storing a document in Elasticsearch it will automatically generate an id for you that is also returned in the result.

{
 "_index":"conferences",
 "_type":"talk",
 "_id":"GqjY7l8sTxa3jLaFx67_aw",
 "_version":1,
 "created":true
}

In case you want to determine the id yourself you can also use a PUT on the same URL we have seen above plus the id. I don't want to get into trouble by calling this RESTful but did you notice that Elasticsearch makes good use of the HTTP verbs?

Either way how you stored the document you can always retrieve it by specifying the index, type and id.

curl -XGET http://localhost:9200/conferences/talk/GqjY7l8sTxa3jLaFx67_aw?pretty=true

which will respond with something like this:

{
  "_index" : "conferences",
 [...]
  "_source":{
    "title" : "Anwendungsfälle für Elasticsearch",
    "speaker" : "Florian Hopf",
    "date" : "2014-07-17T15:35:00.000Z",
    "tags" : ["Java", "Lucene"],
    "conference" : {
        "name" : "Java Forum Stuttgart",
        "city" : "Stuttgart"
    } 
}
}

You can see that the source in the response contains exactly the document we have indexed before.

Distributed Storage

So far we have seen how Elasticsearch stores and retrieves documents and we have learned that you can evolve the schema of your documents. The huge benefit we haven't touched so far is that it is distributed. Each index can be split into several shards that can then be distributed across several machines.

To see the distributed nature in action fortunately we don't need several machines. First, let's see the state of our currently running instance in the plugin elasticsearch-kopf (See this post on details how to install and use it):

On the left you can see that there is one machine running. The row on top shows that it contains our index conferences. Even though we didn't explicitly tell Elasticsearch it created 5 shards for our index that are currently all on the instance we started. As each of the shards is a Lucene index in itself even if you are running your index on one instance the documents you are storing are already distributed across several Lucene indexes.

We can now use the same installation to start another node. After a short time we should see the instance in the dashboard as well.

As the new node joins the cluster (which by default happens automatically) Elasticsearch will automatically copy the shards to the new node. This is because by default it not only uses 5 shards but also 1 replica, which is a copy of a shard. Replicas are always placed on different nodes than their shards and are used for distributing the load and for fault tolerance. If one of the nodes crashes the data is still available on the other node.

Now, if we start another node something else will happen. Elasticsearch will rebalance the shards. It will copy and move shards to the new node so that the shards are distributed evenly across the machines.

Once defined when creating an index the number of shards can't be changed. That's why you normally overallocate (create more shards than you need right now) or if your data allows it you can create time based indices. Just be aware that sharding comes with some cost and think carefully about what you need. Designing your distribution setup can still be difficult even with Elasticsearch does a lot for you out of the box.

Conclusion

In this post we have seen how easy it is to store and retrieve documents using Elasticsearch. JSON and HTTP are technologies that are available in lots of programming environments. The schema of your documents can be evolved as your requirements change. Elasticsearch distributes the data by default and lets you scale across several machines so it is suited well even for very large data sets.

Though using Elasticsearch as a document store is a real use case it is hard to find users that are only using it that way. Nobody retrieves the documents only by id as we have seen in this post but uses the rich query facilities we will look at next week. Nevertheless you can read about how Hipchat uses Elasticsearch to store billions of messages and how Engagor uses Elasticsearch here and here. Both of them are using Elasticsearch as their primary storage.

Though it sounds more drastic than it probably is: If you are considering using Elasticsearch as your primary storage you should also read this analysis of Elasticsearchs behaviour in case of network partitions. Next week we will be looking at using Elasticsearch for something obvious: Search.

Freitag, 27. Juni 2014

Goodbye Sense - Welcome Alternatives?

I only recently noticed that Sense, the Chrome Plugin for Elasticsearch has been pulled from the app store by its creator. There are quite strong opinions in this thread and I would like to have Sense as a Chrome plugin as well. But I am also totally fine with Elasticsearch as a company trying to monetize some of its products so that is maybe something we just have to accept. What is interesting is that it isn't even possible to fork the project and keep developing it as there is no explicit license in the repo. I guess there is a lesson buried somewhere in here.

In this post I would like to look at some of the alternatives for interacting with Elasticsearch. Though the good thing about Sense is that it is independent from the Elasticsearch installation we are looking at plugins here. It might be possible to use some of them without installing them in Elasticsearch but I didn't really try. The plugins are generally doing more things but I am looking at the REST capabilities only.

Marvel

Marvel is the commercial plugin by Elasticsearch (free for development purposes). Though it does lots of additional things, it contains the new version of Sense. Marvel will track lots of the state and interaction with Elasticsearch in a seperate index so be aware that it might store quite some data. Also of course you need to respect the license; when using it on a production system you need to pay.

The main Marvel dashboard, which is Kibana, is available at http://localhost:9200/_plugin/marvel. Sense can be accessed directly using http://localhost:9200/_plugin/marvel/sense/index.html.

The Sense version of Marvel behaves exactly like the one you are used from the Chrome plugin. It has highlighting, autocompletion (even for new features), the history and the formatting.

elasticsearch-head

elasticsearch-head seems to be one of the oldest plugins available for Elasticsearch and it is recommended a lot. The main dashboard is available at http://localhost:9200/_plugin/head/ which contains the cluster overview.

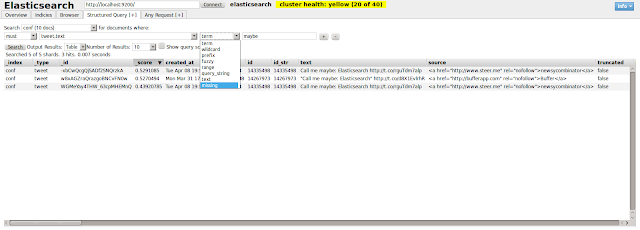
There is an interface for building queries at the Structured Query tab./p>

It lets you execute queries by selecting values from dropdown boxes and it can even detect fields that are available for the index and type. Results are displayed in a table. Unfortunately the values that can be selected are rather outdated. Instead of the match query it still contains the text query that is deprecated since Elasticsearch 0.19.9 and is not available anymore with newer versions of Elasticsearch.

Another interface on the Any Request tab lets you execute custom requests.

The text box that accepts the body has no highlighting and it is not possble to use tabs but errors will be displayed, the response is formatted, links are set and you do have the option to use a table or the JSON format for responses. The history lets you execute older queries.

There are other options like Result Transformer that sound interesting but I have never tried those.

elasticsearch-kopf

elasticsearch-kopf is a clone of elasticsearch-head that also provides an interface to send arbitrary requests to Elasticsearch.

You can enter queries and let them be executed for you. There is a request history, you have highlighting and you can format the request document but unfortunately the interface is missing a autocompletion.

If you'd like to learn more about elasticsearch-kopf I have recently published a tour through its features.

Inquisitor

Inquisitor is a tool to help you understand Elasticsearch queries. Besides other options it allows you to execute search queries.

Index and type can be chosen from the ones available in the cluster. There is no formatting in the query field, you can't even use tabs for indentation, but errors in your query are displayed in the panel on top of the results while typing. The response is displayed in a table, matching fields are automatically highlighted. Because of the limited possibilites when entering text the plugin seems to be more useful when it comes to the analyzing part or for pasting existing queries

Elastic-Hammer

Andrew Cholakian, the author of Exploring Elasticsearch, has published another query tool, Elastic-Hammer. It can either be installed locally or used as an online version directly.

It is a quite useful query tool that will display syntactic errors in your query and format images and links in a pretty response. It even offers autocompletion though not as elaborated as the one Sense and Marvel are providing: It will display any allowed term, no matter the context. So you can't really see which terms currently are allowed but only that the term is allowed at all. Nevertheless this can be useful. Searches can also be saved in local storage and executed again.

Conclusion

Currently none of the free and open source plugins seems to provide an interface that is as good as the one contained in Sense and Marvel. As Marvel is free for development you can still use but you need to install it in the instances again. Sense was more convenient and easier to start but I guess one can get along with Marvel the same way.

Finally I wouldn't be surprised if someone from the very active Elasticsearch community comes up with another tool that can take the place of Sense again.

Freitag, 20. Juni 2014

An Alternative to the Twitter River - Index Tweets in Elasticsearch with Logstash

For some time now I've been using the Elasticsearch Twitter river for streaming conference tweets to Elasticsearch. The river runs on an Elasticsearch node, tracks the Twitter streaming API for keywords and directly indexes the documents in Elasticsearch. As the rivers are about to be deprecated it is time to move on to the recommended replacement: Logstash.

With Logstash the retrieval of the Twitter data is executed in a different process, probably even on a different machine. This helps in scaling Logstash and Elasticsearch seperately.

Installation

The installation of Logstash is nearly as easy as the one for Elasticsearch though you can't start it without a configuration that tells it what you want it to do. You can download it, unpack the archive and there are scripts to start it. If you are fine with using the embedded Elasticsearch instance you don't even need to install this separately. But you need to have a configuration file in place that tells Logstash what to do exactly.

Configuration

The configuration for Logstash normally consists of three sections: The input, optional filters and the output section. There is a multitude of existing components for each of those available. The structure of a config file looks like this (taken from the documentation):

# This is a comment. You should use comments to describe
# parts of your configuration.
input {
  ...
}

filter {
  ...
}

output {
  ...
}

We are using the Twitter input, the elasticsearch_http output and no filters.

Twitter

As with any Twitter API interaction you need to have an account and configure the access tokens.

input {
    twitter {
        # add your data
        consumer_key => ""
        consumer_secret => ""
        oauth_token => ""
        oauth_token_secret => ""
        keywords => ["elasticsearch"]
        full_tweet => true
    }
}

You need to pass in all the credentials as well as the keywords to track. By enabling the full_tweet option you can index a lot more data, by default there are only a few fields and interesting information like hashtags or mentions are missing.

The Twitter river seems to have different names than the ones that are sent with the raw tweets so it doesn't seem to be possible to easily index Twitter logstash data along with data created by the Twitter river. But it should be no big deal to change the Logstash field names as well with a filter.

Elasticsearch

There are three plugins that are providing an output to Elasticsearch: elasticsearch, elasticsearch_http and elasticsearch_river. elasticsearch provides the opportunity to bind to an Elasticsearch cluster as a node or via transport, elasticsearch_http uses the HTTP API and elasticsearch_river communicates via the RabbitMQ river. The http version lets you use different Elasticsearch versions for Logstash and Elasticsearch, this is the one I am using. Note that the elasticsearch plugin also provides an option for setting the protocol to http that also seems to work.

output {
    elasticsearch_http {
        host => "localhost"
        index => "conf"
        index_type => "tweet"
    }
}

In contrast to the Twitter river the Logstash plugin does not create a special mapping for the tweets. I didn't go through all the fields but for example the coordinates don't seem to be mapped correctly to geo_point and some fields are analyzed that probably shouldn't be (urls, usernames). If you are using those you might want to prepare your index by supplying it with a custom mapping.

By default tweets will be pushed to Elasticsearch every second which should be enough for any analysis. You can even think about reducing this with the property idle_flush_time.

Running

Finally, when all of the configuration is in place you can execute Logstash using the following command (assuming the configuration is in a file twitter.conf):

bin/logstash agent -f twitter.conf

Nothing left to do but wait for the first tweets to arrive in your local instance at http://localhost:9200/conf/tweet/_search?q=*:*&pretty=true.

For the future it would be really useful to prepare a mapping for the fields and a filter that removes some of the unused data. For now you have to check what you would like to use of the data and prepare a mapping in advance.

Freitag, 13. Juni 2014

A Tour Through elasticsearch-kopf

When I needed a plugin to display the cluster state of Elasticsearch or needed some insight into the indices I normally reached for the classic plugin elasticsearch-head. As it is recommended a lot and seems to be the unofficial successor I recently took a more detailed look at elasticsearch-kopf. And I like it.

I am not sure about why elasticsearch-kopf came into existence but it seems to be a clone of elasticsearch-head (kopf means head in German so it is even the same name).

Installation

elasticsearch-kopf can be installed like most of the plugins, using the script in the Elasticsearch installation. This is the command that installs the version 1.1 which is suitable for the 1.1.x branch of Elasticsearch.

bin/plugin --install lmenezes/elasticsearch-kopf/1.1

elasticsearch-kopf is then available on the url http://localhost:9200/_plugin/kopf/.

Cluster

On the front page you will see a similar diagram of what elasticsearch-head is providing. The overview of your cluster with all the shards and the distribution across the nodes. The page is being refreshed so you will see joining or leaving nodes immediately. You can adjust the refresh rate in the settings dropdown just next to the kopf logo (by the way, the header reflects the state of the cluster so it might change its color from green to yellow to red).

Also, there are lots of different settings that can be reached via this page. On top of the node list there are 4 icons for creating a new index, deactivating shard allocation, for the cluster settings and the cluster diagnosis options.

Creating a new index brings up a form for entering the index data. You can also load the settings from an existing index or just paste the settings json in the field on the right side.

The icon for disabling the shard allocation just toggles it, disabling the shard allocation can be useful during a cluster restart. Using the cluster settings you can reach a form where you can adjust lots of values regarding your cluster, the routing and recovery. The cluster health button finally lets you load different json documents containing more details on the cluster health, e.g. the nodes stats and the hot threads.

Using the little dropdown just next to the index name you can execute some operations on the index. You can view the settings, open and close the index, optimize and refresh the index, clear the caches, adjust the settings or delete the index.

When opening the form for the index settings you will be overwhelmed at first. I didn't know there are so many settings. What is really useful is that there is an info icon next to each field that will tell you what this field is about. A great opportunity to learn about some of the settings.

What I find really useful is that you can adjust the slow index log settings directly. The slow log can also be used to log any incoming queries so it is sometimes useful for diagnostic purposes.

Finally, back on the cluster page, you can get more detailed information on the nodes or shards when clicking on them. This will open a lightbox with more details.

REST

The rest menu entry on top brings you to another view which is similar to the one Sense provided. You can enter queries and let them be executed for you. There is a request history, you have highlighting and you can format the request document but unfortunately the interface is missing the autocompletion. Nevertheless I suppose this can be useful if you don't like to fiddle with curl.

Aliases

Using the aliases tab you can have a convenient form for managing your index aliases and all the relevant additional information. You can add filter queries for your alias or influence the index or search routing. On the right side you can see the existing aliases and remove them if not needed.

Analysis

The analysis tab will bring you to a feature that is also very popular for the Solr administration view. You can test the analyzers for different values and different fields. This is a very valuable tool while building a more complex search application.

Unfortunately the information you can get from Elasticsearch is not as detailed as the one you can get from Solr: It will only contain the end result so you can't really see which tokenizer or filter caused a certain change.

Percolator

On the percolator tab you can use a form to register new percolator queries and view existing ones. There doesn't seem to be a way to do the actual percolation but maybe this page can be useful for using the percolator extensively.

Warmers

The warmers tab can be used to register index warmer queries.

Repository

The final tab is for the snapshot and restore feature. You can create repositories and snapshots and restore them. Though I can imagine that most of the people are automating the snapshot creation this can be a very useful form.

Conclusion

I hope you could see in this post that elasticsearch-kopf can be really useful. It is very unlikely that you will ever need all of the forms but it is good to have them available. The cluster view and the rest interface can be very valuable for your daily work and I guess there will be new features coming in the future.

Elasticsearch - Der praktische Einstieg
Java Code Geeks