Freitag, 27. Juni 2014

Goodbye Sense - Welcome Alternatives?

I only recently noticed that Sense, the Chrome Plugin for Elasticsearch has been pulled from the app store by its creator. There are quite strong opinions in this thread and I would like to have Sense as a Chrome plugin as well. But I am also totally fine with Elasticsearch as a company trying to monetize some of its products so that is maybe something we just have to accept. What is interesting is that it isn't even possible to fork the project and keep developing it as there is no explicit license in the repo. I guess there is a lesson buried somewhere in here.

In this post I would like to look at some of the alternatives for interacting with Elasticsearch. Though the good thing about Sense is that it is independent from the Elasticsearch installation we are looking at plugins here. It might be possible to use some of them without installing them in Elasticsearch but I didn't really try. The plugins are generally doing more things but I am looking at the REST capabilities only.

Marvel

Marvel is the commercial plugin by Elasticsearch (free for development purposes). Though it does lots of additional things, it contains the new version of Sense. Marvel will track lots of the state and interaction with Elasticsearch in a seperate index so be aware that it might store quite some data. Also of course you need to respect the license; when using it on a production system you need to pay.

The main Marvel dashboard, which is Kibana, is available at http://localhost:9200/_plugin/marvel. Sense can be accessed directly using http://localhost:9200/_plugin/marvel/sense/index.html.

The Sense version of Marvel behaves exactly like the one you are used from the Chrome plugin. It has highlighting, autocompletion (even for new features), the history and the formatting.

elasticsearch-head

elasticsearch-head seems to be one of the oldest plugins available for Elasticsearch and it is recommended a lot. The main dashboard is available at http://localhost:9200/_plugin/head/ which contains the cluster overview.

There is an interface for building queries at the Structured Query tab./p>

It lets you execute queries by selecting values from dropdown boxes and it can even detect fields that are available for the index and type. Results are displayed in a table. Unfortunately the values that can be selected are rather outdated. Instead of the match query it still contains the text query that is deprecated since Elasticsearch 0.19.9 and is not available anymore with newer versions of Elasticsearch.

Another interface on the Any Request tab lets you execute custom requests.

The text box that accepts the body has no highlighting and it is not possble to use tabs but errors will be displayed, the response is formatted, links are set and you do have the option to use a table or the JSON format for responses. The history lets you execute older queries.

There are other options like Result Transformer that sound interesting but I have never tried those.
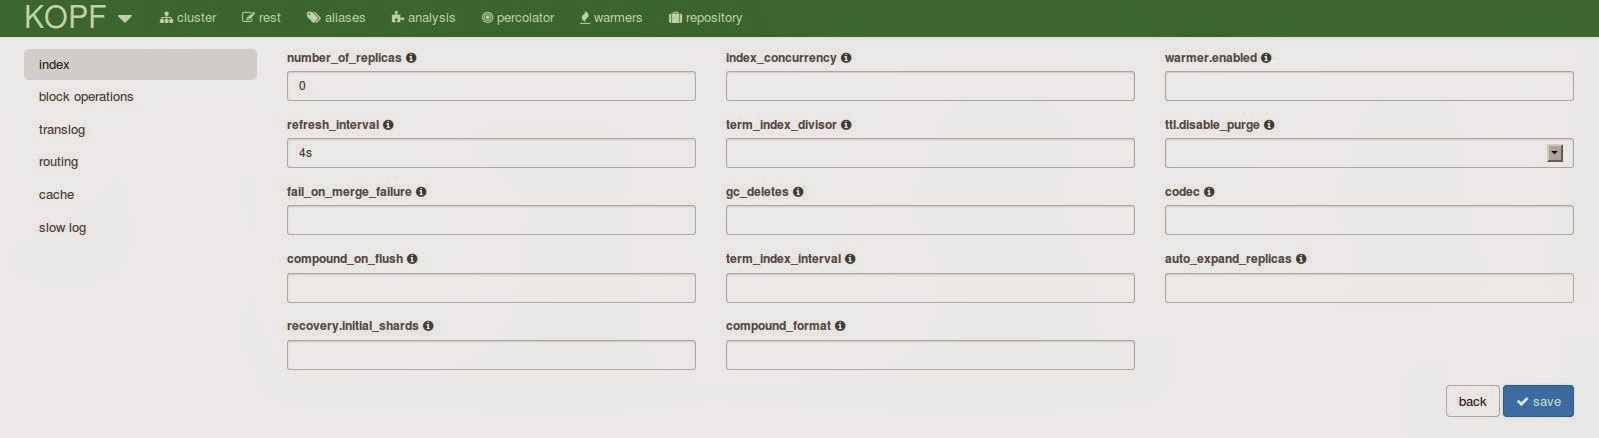
elasticsearch-kopf

elasticsearch-kopf is a clone of elasticsearch-head that also provides an interface to send arbitrary requests to Elasticsearch.

You can enter queries and let them be executed for you. There is a request history, you have highlighting and you can format the request document but unfortunately the interface is missing a autocompletion.

If you'd like to learn more about elasticsearch-kopf I have recently published a tour through its features.

Inquisitor

Inquisitor is a tool to help you understand Elasticsearch queries. Besides other options it allows you to execute search queries.

Index and type can be chosen from the ones available in the cluster. There is no formatting in the query field, you can't even use tabs for indentation, but errors in your query are displayed in the panel on top of the results while typing. The response is displayed in a table, matching fields are automatically highlighted. Because of the limited possibilites when entering text the plugin seems to be more useful when it comes to the analyzing part or for pasting existing queries

Elastic-Hammer

Andrew Cholakian, the author of Exploring Elasticsearch, has published another query tool, Elastic-Hammer. It can either be installed locally or used as an online version directly.

It is a quite useful query tool that will display syntactic errors in your query and format images and links in a pretty response. It even offers autocompletion though not as elaborated as the one Sense and Marvel are providing: It will display any allowed term, no matter the context. So you can't really see which terms currently are allowed but only that the term is allowed at all. Nevertheless this can be useful. Searches can also be saved in local storage and executed again.

Conclusion

Currently none of the free and open source plugins seems to provide an interface that is as good as the one contained in Sense and Marvel. As Marvel is free for development you can still use but you need to install it in the instances again. Sense was more convenient and easier to start but I guess one can get along with Marvel the same way.

Finally I wouldn't be surprised if someone from the very active Elasticsearch community comes up with another tool that can take the place of Sense again.

Freitag, 20. Juni 2014

An Alternative to the Twitter River - Index Tweets in Elasticsearch with Logstash

For some time now I've been using the Elasticsearch Twitter river for streaming conference tweets to Elasticsearch. The river runs on an Elasticsearch node, tracks the Twitter streaming API for keywords and directly indexes the documents in Elasticsearch. As the rivers are about to be deprecated it is time to move on to the recommended replacement: Logstash.

With Logstash the retrieval of the Twitter data is executed in a different process, probably even on a different machine. This helps in scaling Logstash and Elasticsearch seperately.

Installation

The installation of Logstash is nearly as easy as the one for Elasticsearch though you can't start it without a configuration that tells it what you want it to do. You can download it, unpack the archive and there are scripts to start it. If you are fine with using the embedded Elasticsearch instance you don't even need to install this separately. But you need to have a configuration file in place that tells Logstash what to do exactly.

Configuration

The configuration for Logstash normally consists of three sections: The input, optional filters and the output section. There is a multitude of existing components for each of those available. The structure of a config file looks like this (taken from the documentation):

# This is a comment. You should use comments to describe
# parts of your configuration.
input {
  ...
}

filter {
  ...
}

output {
  ...
}

We are using the Twitter input, the elasticsearch_http output and no filters.

Twitter

As with any Twitter API interaction you need to have an account and configure the access tokens.

input {
    twitter {
        # add your data
        consumer_key => ""
        consumer_secret => ""
        oauth_token => ""
        oauth_token_secret => ""
        keywords => ["elasticsearch"]
        full_tweet => true
    }
}

You need to pass in all the credentials as well as the keywords to track. By enabling the full_tweet option you can index a lot more data, by default there are only a few fields and interesting information like hashtags or mentions are missing.

The Twitter river seems to have different names than the ones that are sent with the raw tweets so it doesn't seem to be possible to easily index Twitter logstash data along with data created by the Twitter river. But it should be no big deal to change the Logstash field names as well with a filter.

Elasticsearch

There are three plugins that are providing an output to Elasticsearch: elasticsearch, elasticsearch_http and elasticsearch_river. elasticsearch provides the opportunity to bind to an Elasticsearch cluster as a node or via transport, elasticsearch_http uses the HTTP API and elasticsearch_river communicates via the RabbitMQ river. The http version lets you use different Elasticsearch versions for Logstash and Elasticsearch, this is the one I am using. Note that the elasticsearch plugin also provides an option for setting the protocol to http that also seems to work.

output {
    elasticsearch_http {
        host => "localhost"
        index => "conf"
        index_type => "tweet"
    }
}

In contrast to the Twitter river the Logstash plugin does not create a special mapping for the tweets. I didn't go through all the fields but for example the coordinates don't seem to be mapped correctly to geo_point and some fields are analyzed that probably shouldn't be (urls, usernames). If you are using those you might want to prepare your index by supplying it with a custom mapping.

By default tweets will be pushed to Elasticsearch every second which should be enough for any analysis. You can even think about reducing this with the property idle_flush_time.

Running

Finally, when all of the configuration is in place you can execute Logstash using the following command (assuming the configuration is in a file twitter.conf):

bin/logstash agent -f twitter.conf

Nothing left to do but wait for the first tweets to arrive in your local instance at http://localhost:9200/conf/tweet/_search?q=*:*&pretty=true.

For the future it would be really useful to prepare a mapping for the fields and a filter that removes some of the unused data. For now you have to check what you would like to use of the data and prepare a mapping in advance.

Freitag, 13. Juni 2014

A Tour Through elasticsearch-kopf

When I needed a plugin to display the cluster state of Elasticsearch or needed some insight into the indices I normally reached for the classic plugin elasticsearch-head. As it is recommended a lot and seems to be the unofficial successor I recently took a more detailed look at elasticsearch-kopf. And I like it.

I am not sure about why elasticsearch-kopf came into existence but it seems to be a clone of elasticsearch-head (kopf means head in German so it is even the same name).

Installation

elasticsearch-kopf can be installed like most of the plugins, using the script in the Elasticsearch installation. This is the command that installs the version 1.1 which is suitable for the 1.1.x branch of Elasticsearch.

bin/plugin --install lmenezes/elasticsearch-kopf/1.1

elasticsearch-kopf is then available on the url http://localhost:9200/_plugin/kopf/.

Cluster

On the front page you will see a similar diagram of what elasticsearch-head is providing. The overview of your cluster with all the shards and the distribution across the nodes. The page is being refreshed so you will see joining or leaving nodes immediately. You can adjust the refresh rate in the settings dropdown just next to the kopf logo (by the way, the header reflects the state of the cluster so it might change its color from green to yellow to red).

Also, there are lots of different settings that can be reached via this page. On top of the node list there are 4 icons for creating a new index, deactivating shard allocation, for the cluster settings and the cluster diagnosis options.

Creating a new index brings up a form for entering the index data. You can also load the settings from an existing index or just paste the settings json in the field on the right side.

The icon for disabling the shard allocation just toggles it, disabling the shard allocation can be useful during a cluster restart. Using the cluster settings you can reach a form where you can adjust lots of values regarding your cluster, the routing and recovery. The cluster health button finally lets you load different json documents containing more details on the cluster health, e.g. the nodes stats and the hot threads.

Using the little dropdown just next to the index name you can execute some operations on the index. You can view the settings, open and close the index, optimize and refresh the index, clear the caches, adjust the settings or delete the index.

When opening the form for the index settings you will be overwhelmed at first. I didn't know there are so many settings. What is really useful is that there is an info icon next to each field that will tell you what this field is about. A great opportunity to learn about some of the settings.

What I find really useful is that you can adjust the slow index log settings directly. The slow log can also be used to log any incoming queries so it is sometimes useful for diagnostic purposes.

Finally, back on the cluster page, you can get more detailed information on the nodes or shards when clicking on them. This will open a lightbox with more details.

REST

The rest menu entry on top brings you to another view which is similar to the one Sense provided. You can enter queries and let them be executed for you. There is a request history, you have highlighting and you can format the request document but unfortunately the interface is missing the autocompletion. Nevertheless I suppose this can be useful if you don't like to fiddle with curl.

Aliases

Using the aliases tab you can have a convenient form for managing your index aliases and all the relevant additional information. You can add filter queries for your alias or influence the index or search routing. On the right side you can see the existing aliases and remove them if not needed.

Analysis

The analysis tab will bring you to a feature that is also very popular for the Solr administration view. You can test the analyzers for different values and different fields. This is a very valuable tool while building a more complex search application.

Unfortunately the information you can get from Elasticsearch is not as detailed as the one you can get from Solr: It will only contain the end result so you can't really see which tokenizer or filter caused a certain change.

Percolator

On the percolator tab you can use a form to register new percolator queries and view existing ones. There doesn't seem to be a way to do the actual percolation but maybe this page can be useful for using the percolator extensively.

Warmers

The warmers tab can be used to register index warmer queries.

Repository

The final tab is for the snapshot and restore feature. You can create repositories and snapshots and restore them. Though I can imagine that most of the people are automating the snapshot creation this can be a very useful form.

Conclusion

I hope you could see in this post that elasticsearch-kopf can be really useful. It is very unlikely that you will ever need all of the forms but it is good to have them available. The cluster view and the rest interface can be very valuable for your daily work and I guess there will be new features coming in the future.

Elasticsearch - Der praktische Einstieg
Java Code Geeks