In the last posts we have seen some of the properties of using Elasticsearch as a document store, for searching text content and geospatial search. In this post we will look at how it can be used to index and store log files, a very useful application that can help developers and operations in maintaining applications.
Logging
When maintaining larger applications that are either distributed across several nodes or consist of several smaller applications searching for events in log files can become tedious. You might already have been in the situation that you have to find an error and need to log in to several machines and look at several log files. Using Linux tools like grep can be fun sometimes but there are more convenient ways. Elasticsearch and the projects Logstash and Kibana, commonly known as the ELK stack, can help you with this.
With the ELK stack you can centralize your logs by indexing them in Elasticsearch. This way you can use Kibana to look at all the data without having to log in on the machine. This can also make Operations happy as they don't have to grant access to every developer who needs to have access to the logs. As there is one central place for all the logs you can even see different applications in context. For example you can see the logs of your Apache webserver combined with the log files of your application server, e.g. Tomcat. As search is core to what Elasticsearch is doing you should be able to find what you are looking for even more quickly.
Finally Kibana can also help you with becoming more proactive. As all the information is available in real time you also have a visual representation of what is happening in your system in real time. This can help you in finding problems more quickly, e.g. you can see that some resource starts throwing Exceptions without having your customers report it to you.
The ELK Stack
For logfile analytics you can use all three applications of the ELK stack: Elasticsearch, Logstash and Kibana. Logstash is used to read and enrich the information from log files. Elasticsearch is used to store all the data and Kibana is the frontend that provides dashboards to look at the data.
The logs are fed into Elasticsearch using Logstash that combines the different sources. Kibana is used to look at the data in Elasticsearch. This setup has the advantage that different parts of the log file processing system can be scaled differently. If you need more storage for the data you can add more nodes to the Elasticsearch cluster. If you need more processing power for the log files you can add more nodes for Logstash.
Logstash
Logstash is a JRuby application that can read input from several sources, modify it and push it to a multitude of outputs. For running Logstash you need to pass it a configuration file that determines where the data is and what should be done with it. The configuration normally consists of an input and an output section and an optional filter section. This example takes the Apache access logs, does some predefined processing and stores them in Elasticsearch:
input {
  file {
    path => "/var/log/apache2/access.log"
  }
}

filter {
  grok {
    match => { message => "%{COMBINEDAPACHELOG}" }
  }
}

output {
  elasticsearch_http {
    host => "localhost"
  }
}
The file input reads the log files from the path that is supplied. In the filter section we have defined the grok filter that parses unstructured data and structures it. It comes with lots of predefined patterns for different systems. In this case we are using the complete Apache log pattern but there are also more basic building block like parsing email and ip addresses and dates (which can be lots of fun with all the different formats).
In the output section we are telling Logstash to push the data to Elasticsearch using http. We are using a server on localhost, for most real world setups this would be a cluster on separate machines.
Kibana
Now that we have the data in Elasticsearch we want to look at it. Kibana is a JavaScript application that can be used to build dashboards. It accesses Elasticsearch from the browser so whoever uses Kibana needs to have access to Elasticsearch.
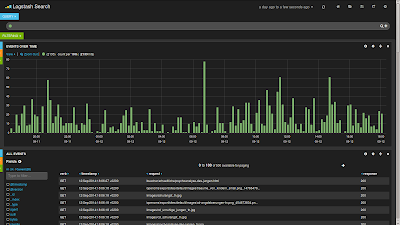
When using it with Logstash you can open a predefined dashboard that will pull some information from your index. You can then display charts, maps and tables for the data you have indexed. This screenshot displays a histogram and a table of log events but there are more widgets available like maps and pie and bar charts.
As you can see you can extract a lot of data visually that would otherwise be buried in several log files.
Conclusion
The ELK stack can be a great tool to read, modify and store log events. Dashboards help with visualizing what is happening. There are lots of inputs in Logstash and the grok filter supplies lots of different formats. Using those tools you can consolidate and centralize all your log files.
Lots of people are using the stack for analyzing their log file data. One of the articles that is available is by Mailgun, who are using it to store billions of events. And if that's not enough read this post on how CERN uses the ELK stack to help running the Large Hadron Collider
In the next post we will look at the final use case for Elasticsearch: Analytics.


